Anomaly Detection in AI models
Anomaly Detection in AI models
Data Pre-Processing

Detecting anomalous data is crucial at every stage of modelling pipeline, starting from data pre-preparation to monitoring predictions. In today’s article we will discuss the importance of flagging anomalous data before model training.
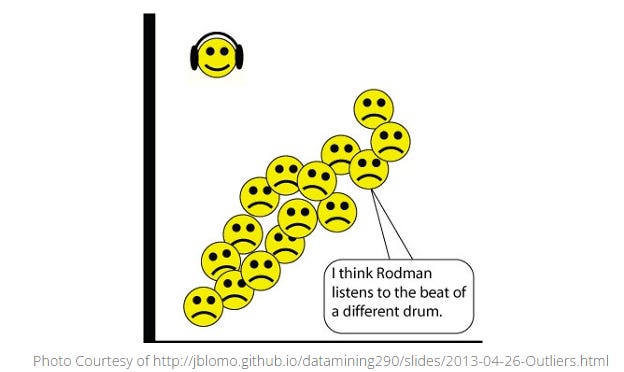
Anomalous data in the context of data science models refers to data points that deviate significantly from the original or expected distribution of the data. These data points also known as ‘outliers’ could occur due to various reasons such as error in the collection of dataset, noise introduced due to rare but significant events or due to variability in the data generation process. Not handling the outliers before training the model may significantly affect the quality of predictions due to the following aspects.
Bias and Variance : Outliers introduces bias and increases variance in the model which would lead to skewed predictions that does not accurately represents the relationship in the data.
Overfitting : Model trained on the data with outliers will try to fit closely to the noise in addition to the true signal in the data. This causes the model to overfit where the performance is good on the training data while poor on test data.
Incorrect Parameter Estimates : Outliers in the data can distort the estimation of model parameters leading to incorrect weights and coefficients. This significantly affects the quality of predictions.
Overly complex models : Models trained on the data with outliers will tend to be overly complex in order to accommodate the noise. This leads to difficulty on understanding, interpreting and maintaining such models.
With this understanding, lets dive into some of the most commonly used methods to detect outliers.
Statistical Methods : This is one of the most commonly used and simple approaches to flag outliers
Z-Score : Z-Score represents number of Standard Deviations a data point is from the mean. Data points beyond a z-score threshold is flagged as outliers, most commonly used threshold if z-score > 3.
Interquartile Range : Interquartile range (IQR) is the measure of statistical dispersion of the dataset. It is defined as the range between the first (Q1) and the third quartile (Q3) of the dataset. Generally data points below Q1 - 1.5 *IQR or above Q3 + 1.5* IQR are considered outliers.
Distance-Based Methods : This class is generally used when the data forms natural clusters or when dealing with high-dimensional data.
Euclidean Distance : Euclidean distance is calculated between each point and the centroid, data points that are falling beyond the threshold is flagged as outliers. Threshold in this case is defined based on the distribution of distances eg : 95th or 99th percentile.
K-Nearest Neighbors (KNN) : In this method, the distance between each data point and k-th nearest neighbor is calculated. A common approach is to consider points as outliers if their distance to the k-nearest neighbor is greater than a specified percentile of the distance distribution (e.g., 95th or 99th percentile).
Local Outlier Factor (LOF) : In this method, the local density of a data point is compared to the local densities of neighbors and data points with LOF scores significantly higher than 1 are considered outliers. Most commonly used threshold is LOF > 2.
Machine Learning : When dealing with data with large number of features, traditional outlier detection methods discussed above are less effective due to dimensionality. In such scenarios, following are the most common outlier detection algorithms in use.
Isolation Forest: An ensemble-based method specifically designed to detect outliers. It isolates observations by randomly selecting a feature and then randomly selecting a split value between the maximum and minimum values of the selected feature.
One-Class SVM: A Support Vector Machine method that learns a decision function for outlier detection.
Each method has its strengths and limitations, and the choice of the method depends on the nature of data and domain requirements. Now that we have explore various methods in outlier detection, in the next article we will dive deep into the methods to effectively handle the outliers.
AI Image of the day: Exploring the cosmos, one byte at a time